Jim Wyckoff
Student Achievement Has Been Declining for More Than a Decade, And COVID Isn’t the Only Culprit
For years, educators and policymakers have pointed to the pandemic as the primary driver of falling test scores and widening achievement gaps. But a new national analysis reveals a more troubling reality: America’s academic decline began long before COVID-19.
Between 2009 and 2019, well before remote learning and school closures, student achievement in both reading and math had already started slipping after two decades of steady progress. These declines were widespread, affecting students across grades, subjects, and income levels. While pandemic disruptions deepened the losses, they were not the only causes.
Drawing on more than thirty years of national and state data, this new study offers one of the most comprehensive looks yet at when, where, and why U.S. achievement began to falter. It finds that slowing gains in the late 2000s coincided with major shifts in education policy, school funding, and student well-being. The findings challenge the idea that recovery efforts alone will fix the problem. Instead, they suggest that addressing America’s learning crisis requires rethinking the systems and policies that have quietly eroded academic progress for more than a decade.
STUDY AND METHODS
This study analyzes national and state-level trends in 4th- and 8th-grade math and reading performance over more than three decades, with a focus on identifying when and how academic progress began to slow before the pandemic. The study takes a descriptive and comparative approach, examining how declines align with changes in education policies, economic conditions, and student demographics. The researcher reviews evidence on five major potential contributors: reduced school accountability, post–Great Recession funding cuts, Common Core implementation, rising smartphone and social media use, and shifts in student populations (e.g., increases in English learners and students with disabilities).
KEY FINDINGS
Student achievement in the U.S. was steadily improving between 1990 to about 2013, but then progress stopped. Beginning about 2009 scores began to stall and began declining around 2013, erasing decades of improvement, and the hard-won narrowing of achievement gaps from the 1990s and 2000s has largely unraveled. More than a third (39%) of 8th graders scored “below basic” on the most recent (2024) NAEP assessment, indicating they struggle with foundational concepts like fractions, proportions, and simple algebra.
Figure 1: U.S. NAEP 8th Grade Math, 1990-2024
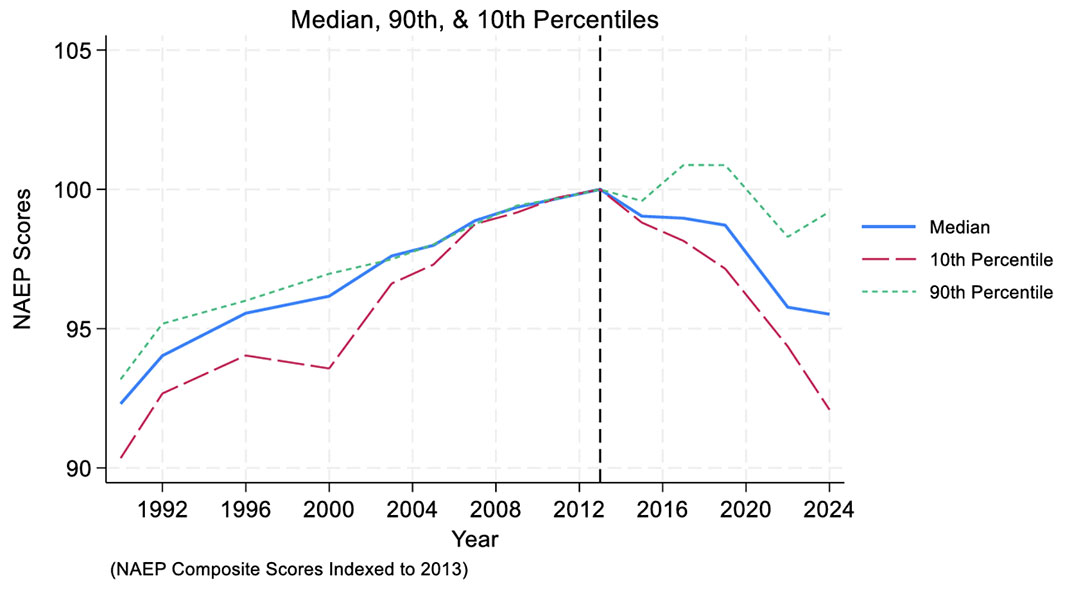
In the graph above, the 90th percentile shows the performance of the highest-achieving students, those scoring better than 90% of their peers. The median (or 50th percentile) represents the typical student, right in the middle of the performance distribution. The 10th percentile shows the lowest-performing students, those scoring better than 10% of their peers.
- Learning declines were largest among lower-performing students, while top-performing students have largely held steady. This has widened the achievement gap between the top 10% and bottom 10% of students in 49 out of 50 states.
- Between 2013 and 2019, for example, 8th-grade math scores at the 10th percentile fell by 17 percent of a standard deviation (SD) of student achievement. The 0.17 SD loss in represents nearly a quarter of the Black-white achievement gap, and is roughly equivalent to 4.5 months of learning.
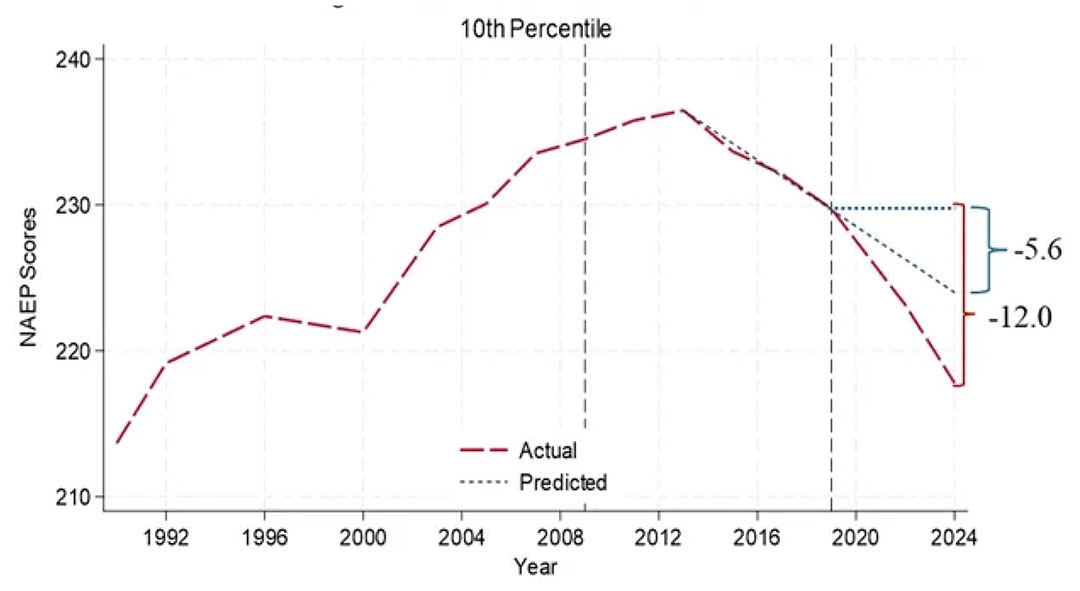
Much of what appears to be “pandemic learning loss” (declines after 2020) was part of a longer-term downward trajectory in student performance that began years earlier.
- The researcher used NAEP 8th grade math scores for students at the 10th percentile and projected forward the trajectory from 2013–2019 (the years before COVID) to estimate what scores would have been in 2024 if those trends had simply continued. That projection predicted a decline of 5.6 scale score points by 2024. However, the actual decline was 12.0 points. Because 5.6 is roughly 47 percent of 12.0, the researcher inferred that nearly half of the total decline observed after 2019 had already been underway before the pandemic.
Figure 2: Actual vs. Predicted NAEP 8th Grade Math Scores for Low-Performing Students (10th Percentile), 1990–2024
- Achievement declines varied widely across states. For example, 14 states experienced large declines (over 0.30 SD) in 8th-grade math performance for low-achieving students, while 6 states saw modest gains over the same period.
- The timing of achievement “peaks” differed substantially across states; some peaked in the early 2000s, others not until the mid-2010s, indicating that state-level policies and contexts strongly shaped learning trajectories.
- States that declined most among low-achieving students tended also to see declines for average and high achievers, suggesting broad systemic factors rather than isolated subgroup effects.
- No single factor explains the pre-pandemic learning loss; instead, multiple overlapping forces that vary across states. Each potential cause outlined below is plausible and aligns with national trends, but we don’t have enough evidence to determine their relative impact.
- Weakened school accountability systems: Following the rollback of No Child Left Behind (NCLB) and the transition to more flexible state-designed systems under ESSA, many states lowered consequences for low performance. At the same time, achievement growth slowed, especially for low-income students.
- Great Recession–era funding cuts: Per-pupil spending fell by about $1,000 nationally and over $2,000 in some states. Evidence cited in the paper suggests these cuts explain roughly one-quarter of the decline in 8th-grade math from 2009 to 2019, particularly in districts that reduced instructional staff or professional supports.
- Implementation of the Common Core: While intended to raise rigor, Common Core rollouts often produced short-term confusion around curriculum, assessment, and teacher training. Some states saw declines in 4th-grade reading during early adoption, and benefits expected for alignment across grades and subjects never fully materialized.
- Rising smartphone and social-media use: The steepest declines in achievement align closely with the period when smartphone access among adolescents surpassed 70%. However, it is hard to reconcile with the wide variation in state achievement declines. There is descriptive research linking heavy social-media use to reduced focus, lower homework time, and increased anxiety, which are factors likely to undermine learning gains.
- Growing shares of students who experience more challenges during learning: English learner (EL) and students with disabilities (SWD) populations have grown steadily since 2000, and both these groups of students consistently score well below their peers. In states with large EL or SWD increases, this likely contributed to more substantial declines.
IMPLICATIONS FOR POLICY AND PRACTICE
- Reversing long-term learning losses will require more than short-term recovery efforts.
- Policymakers must treat declining achievement as a chronic, multi-causal problem, not just a pandemic-era disruption.
- Improving achievement will depend on sustained investments in evidence-informed interventions such as teacher quality, early literacy, and supports for low-performing students.
- Strong state and district reforms may help counteract national achievement declines.
- For example, Mississippi demonstrated that policy choices can counteract national trends: after adopting the science of reading through the 2013 Literacy-Based Promotion Act, 4th-grade reading scores rose by 12 points between 2013 and 2019, while the national average fell by 5 points.
- Evidence from Dee and Novicoff (2023) shows that similar science-of-reading training for California teachers led to significant gains in both reading and math, suggesting that evidence-based instructional reforms can meaningfully boost student learning.
- Although causal studies are limited, Mississippi’s success highlights how well-designed, sustained state policies can blunt or even reverse broader downward trends in achievement.
- Rebuild accountability and data systems that emphasize growth and equity.
- The shift away from No Child Left Behind reduced focus on subgroup achievement; new systems should balance accountability with improvement, spotlighting both progress and persistence of gaps.
- States can use modern longitudinal data systems to track cohort growth, identify lagging groups early, and guide resource allocation more effectively.
FULL WORKING PAPER
This report is based on the EdWorkingPaper “Puzzling Over Declining Academic Achievement,” published in May 2025. The full research paper can be found here: https://edworkingpapers.com/ai25-1197.
The EdWorkingPapers Policy & Practice Series is designed to bridge the gap between academic research and real-world decision-making. Each installment summarizes a newly released EdWorkingPaper and highlights the most actionable insights for policymakers and education leaders. This summary was written by Christina Claiborne.